
CGR Critical Raw Materials
Circularity scenarios: Results and implications
Overview of scenario results
Chapter three established how the five material systems could evolve under current practice. This chapter examines how those trajectories change as circularity ambition increases, and how those effects vary across low, medium, and high decarbonisation pathways. The scenario architecture enables each material to be assessed under nine combinations of decarbonisation pathways and circularity ambition levels, as pictured in the figure below. The contribution of circularity levers (narrow, slow, close) is then isolated before subjecting each material to four types of supply chain disruptions: supply cuts, demand surges, capacity losses, and collection failures.
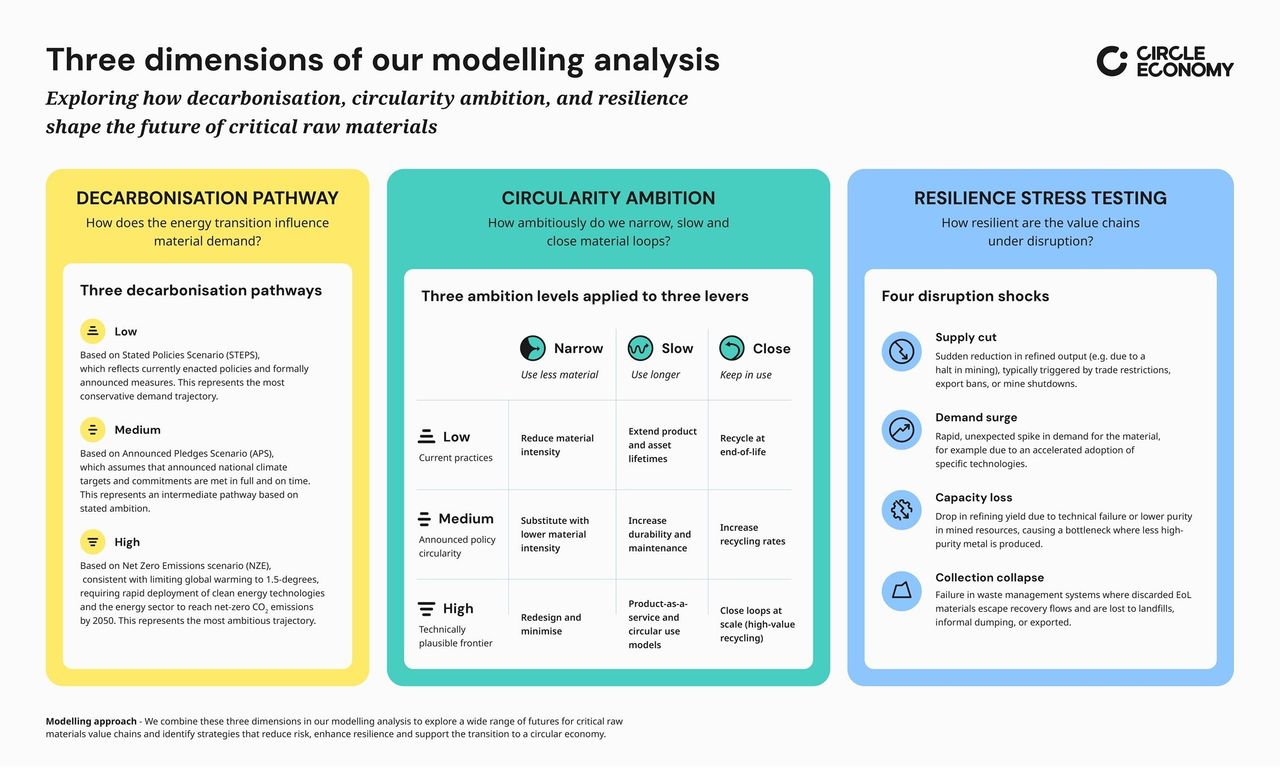
Figure three: An overview of the scenario architecture.
The central finding is that greater circularity reduces the amount of primary material that must be extracted across all materials examined. Under a low decarbonisation scenario, high circularity ambition reduces total cross-material extraction by around 23% between 2025 and 2050 relative to the baseline. Under a high decarbonisation pathway, the reduction relative to the baseline is smaller, at roughly 14%.165 However, the absolute savings remain considerable. Within the high decarbonisation pathway, increasing circularity from low to high reduces total primary material extraction from approximately 866 million tonnes to 720 million tonnes between 2025 and 2050—a savings of 146 million tonnes.
The decreasing share of reductions in material extraction from low- to high-decarbonisation pathways highlights a broader trend: the higher the decarbonisation ambition, the more materially intensive the transition becomes. This pattern holds across nickel, cobalt, lithium, and silicon. Although the exact impact differs by material, each shows a higher share of material extraction under high decarbonisation than under low decarbonisation. This reflects a structural dynamic, not a material-specific assumption—a more rapid transition is more material-intensive, and demand expands faster than circularity levers can mitigate. As material demand grows, circular interventions can avoid larger absolute volumes of primary material use and relieve greater supply pressure, even if the relative share of circular material decreases.
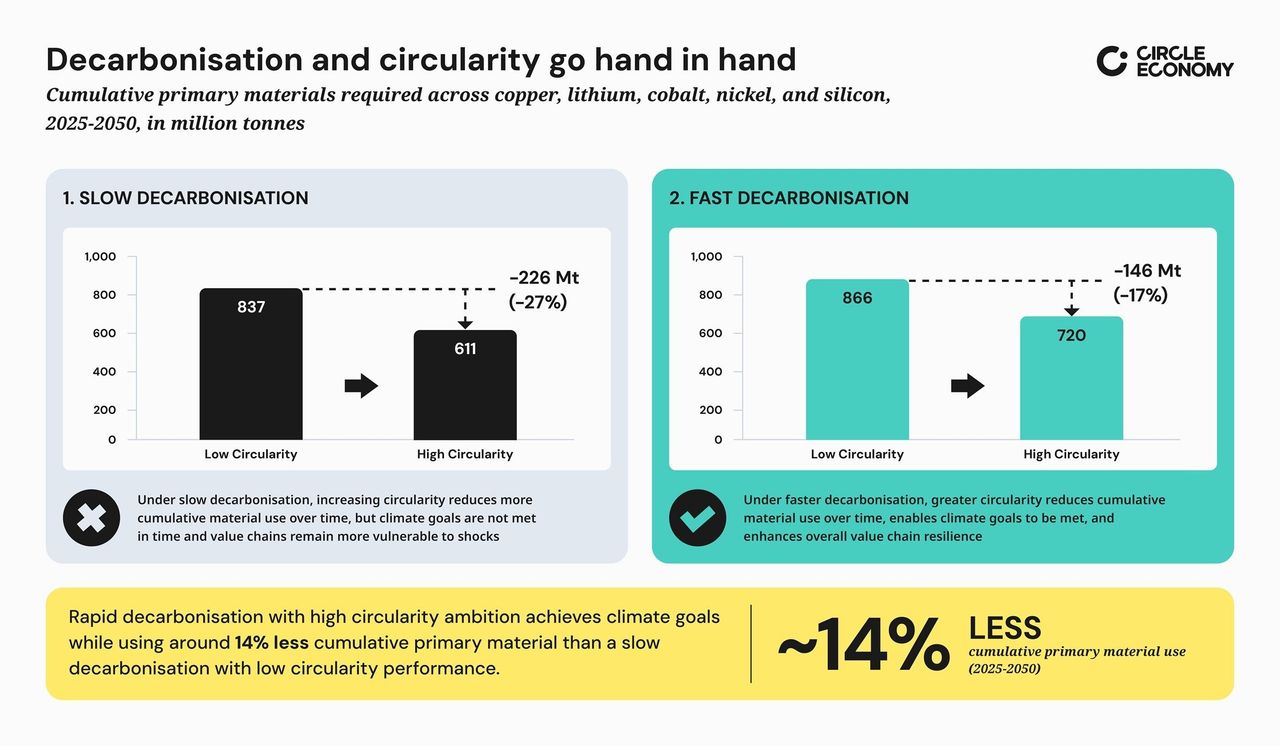
Figure four: Scenario results.
Circularity and supply chain resilience
Circularity's contribution becomes even clearer when considering supply-chain resilience. Here, resilience is measured using accumulated supply deficits, expressed in service-level year-equivalents. These combine how often supply falls short of demand, for how long, and by how much. One year-equivalent therefore represents a deficit equivalent to one full year of unmet demand, whether that deficit occurs during a single severe shortfall or is spread across many smaller ones.
As shown in Chart 43, under low circularity ambition, the average deficit across the five materials rises from 1.62 year-equivalents under low decarbonisation to 2.75 under high decarbonisation. Faster deployment therefore creates more frequent and deeper shortfalls. Increasing circularity ambition to high reduces these deficits to 0.57 year-equivalents under low decarbonisation and 1.23 under high decarbonisation. In absolute terms, raising ambition therefore removes 1.05 year-equivalents of accumulated supply stress under low decarbonisation and 1.52 under high decarbonisation.
Chart 43 depicts the resilience indicators across the materials analysed. There are check boxes that allow for the examination of all indicators, across all materials, or focusing on specific indicators and materials, and the ability to adjust the decarbonisation pathway. The colour (as shown in the second x-axis) becomes darker to illustrate increasing severity, for instance, a darker blue signifies more cumulative primary extraction, a longer period below the threshold of supply, and more extensive and severe supply gaps.
Circularity delivers its greatest absolute resilience benefits where material demand is highest, and the system is under greatest strain. The materials examined in the analysis underpin grid infrastructure, battery manufacturing, and renewable energy generation, meaning that periods of unmet demand can ultimately constrain the deployment of these technologies. Circularity does not eliminate this risk. Even at the highest circularity ambition, a residual deficit of 1.23 year-equivalents remains under high decarbonisation. Nevertheless, it substantially reduces both the frequency and severity of supply shortfalls.
Interpreting the results
The benefits of circularity are understated in this report because the model runs to 2050, while much of the material entering use during the transition period will not reach end of life until after 2050. As a result, the analysis concludes before a substantial proportion of the circularity benefit can materialise. This point will be explored in more depth later on in the chapter.
A key interpretive caution stems from the availability of input data across materials. Cobalt, lithium and silicon all rest on a weaker historical evidence base than copper and nickel: the historical in-use stock series used throughout the projection period and scenario modelling is derived from the model itself rather than from independent input data. For cobalt and lithium, this highlights a second issue—both have young and rapidly expanding in-use stocks with limited historical data on which to base the projection.166
References
- 165. Cross-material figures are unweighted means of the five per-material percentages, so each material contributes equally regardless of the tonnages involved. Weighting by mass would give a different result, since copper and silicon together account for the large majority of cumulative refined tonnage across the five, and silicon responds only marginally to circularity. Absolute tonnages are summed across materials for comparability, although a tonne of one material is not equivalent to a tonne of another in economic, strategic, or environmental terms.
- 166. Estimates for these three materials therefore carry greater uncertainty, and are treated as provisional in the accompanying Methodology Document, which sets out the checks applied to each material.
The Circularity Gap Report is an initiative of Circle Economy, an impact organisation dedicated to accelerating the transition to the circular economy.
© 2008 - Present | RSIN 850278983